Reports and Analytics is the deep view of your business — every dollar billed, every hour worked, every customer touchpoint, sliceable by any dimension. New users typically don’t realize this page is two-tabs deep — the AI Analysis tab on first load is just the entry point; the real visualizations live one click away. This guide is the new-user walkthrough that maps both tabs and shows how to ask actual questions.
Estimated time: 7 minutes
Before You Begin
- Owner or Manager role (Roles, Permissions, and Security)
- A few weeks of operational data — fresh accounts will show empty charts
Step 1: Open the Analytics page
Click Analytics in the left sidebar (or View All → from any KPI tile on the Owner Dashboard). Direct URL: /analytics. The page splits into two tabs across the top.
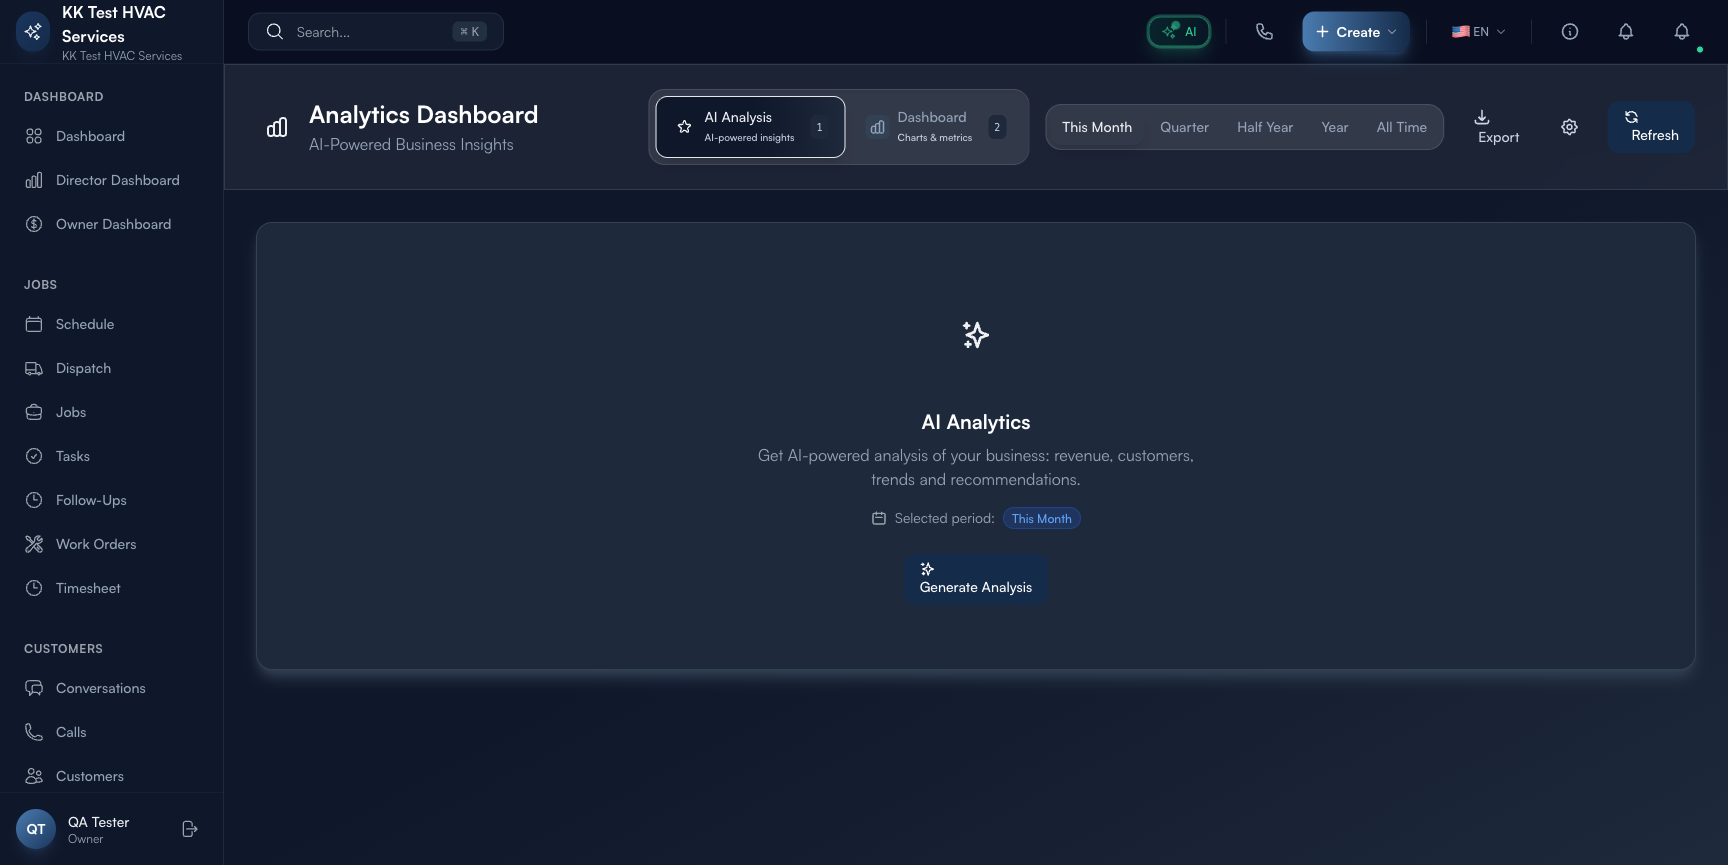
Step 2: Use the period filters
The period selector across the top: This Month / Quarter / Half Year / Year / All Time. Selection drives every chart, AI summary, and export on this page.
![]()
Tip: Use Quarter for trend analysis (smooths out weekly noise), This Month for active triage, and Year for a board meeting or year-over-year comparison.
Step 3: Generate an AI Analysis
The default tab is AI Analysis — Exoserva’s plain-English summary of your data:

Click Generate Analysis. The AI summarizes the period: which segments are growing, where churn is hiding, what’s anomalous. Useful when you don’t know which chart to look at first.
Tip: Re-run the AI analysis monthly. The narrative changes with the data — last month’s “growing” customer segment may be this month’s “stalling”.
Step 4: Switch to Charts & Metrics
Click the Charts & metrics tab. This is where the visualization-heavy view lives:
- Revenue over time — daily/weekly bar chart with comparison to prior period
- Job mix — by service type, by technician, by status
- Customer cohorts — first-time vs repeat, lifetime value buckets
- Operational metrics — avg response time, completion rate, SLA breaches
Hover any chart for tooltip with exact numbers; click for the underlying record list.
Step 5: Export
Click Export in the top-right to download CSV (data tables) or PDF (full dashboard snapshot for board meetings, lender reports, or internal sharing). Exports respect the active period and any filters applied.
Warning: Exported reports may contain customer-level data (names, addresses, revenue). Treat as confidential — store on a locked drive, share only with named recipients.
Step 6: Refresh
Use Refresh to force a re-run if data feels stale. By default Exoserva updates the dashboard every 15 minutes; for spikes (a marketing campaign launch, a major customer’s first job) Refresh fetches the latest in real time.
Step 7: Common new-user questions
Q: My charts are empty. Why?
A: Empty charts mean either (a) no data in the selected period, or (b) you’re a brand-new tenant. Check by switching period to All Time — if charts are still empty, it’s a fresh account; if they’re full, just narrow the period to a longer window.
Q: How is this different from the Owner Dashboard?
A: Owner Dashboard is the 5-minute glance with KPIs and AI Insights. Analytics is the deep dive for “why did revenue drop in week 3?” questions. Use Owner Dashboard daily; Analytics weekly or when investigating a specific issue.
Q: How is this different from Custom Reports?
A: Analytics has pre-built charts; Building Custom Reports lets you drag-and-drop your own questions. Most users start with Analytics; power users build custom reports as their data needs mature.
Q: The AI Analysis just says “no significant patterns” — what now?
A: That usually means low data volume. AI works best on 90+ days of activity. Either wait until you have more data, or switch to Charts & metrics and explore visually.
Q: Can I schedule an automated report?
A: Build a Custom Report (Building Custom Reports), then save it with a delivery schedule (daily/weekly/monthly). Analytics on this page is interactive-only.
Step 8: Common new-user mistakes
- Reading only the AI Analysis tab and skipping Charts & Metrics — AI summaries are great for orientation but charts answer specific questions. Both tabs together; one alone misses half the value.
- Comparing wrong periods — comparing This Month (incomplete, day 5 of 30) to Last Month (full 30 days) gives misleading results. Use Same period last year or Last full month instead.
- Exporting to PDF and treating it as truth — your exported PDF is a snapshot, not live. Numbers update; refresh and re-export when you need current data for a meeting.
Real-World Example
End of quarter. You open Analytics, set period to Quarter, click Generate Analysis. The AI tells you Repeat Customer % grew from 38% to 47% (a win), but average response time slipped from 12 minutes to 18 (a loss). You drill into Charts & Metrics → response time chart, see the spike happened the week your top dispatcher was on vacation, and decide to backstop with an automated AI auto-reply rule for next time. Total time spent: 8 minutes — and you found one structural fix worth a quarter of revenue.
What’s Next?
- Owner/Manager Dashboard Guide — daily-use companion
- Building Custom Reports — drag-and-drop your own questions
- Enterprise Dashboard Multi-Location Management — combine multiple workspaces
- Workflow Builder – Automate Your Operations — turn insights into automation
Need help? Post in the Tech Support category or contact support@exoserva.com.