Properties are central to field service and property management operations. Exoserva links every job, asset, and maintenance schedule to a specific property, giving you a complete history and context for every service call. This guide shows you how to add properties, manage their details, review health scores, configure service areas, and track maintenance history.
Estimated time: 10 minutes
Before You Begin
- An active Exoserva account with Owner, Manager, or Dispatcher role
- You are logged in to the Exoserva platform
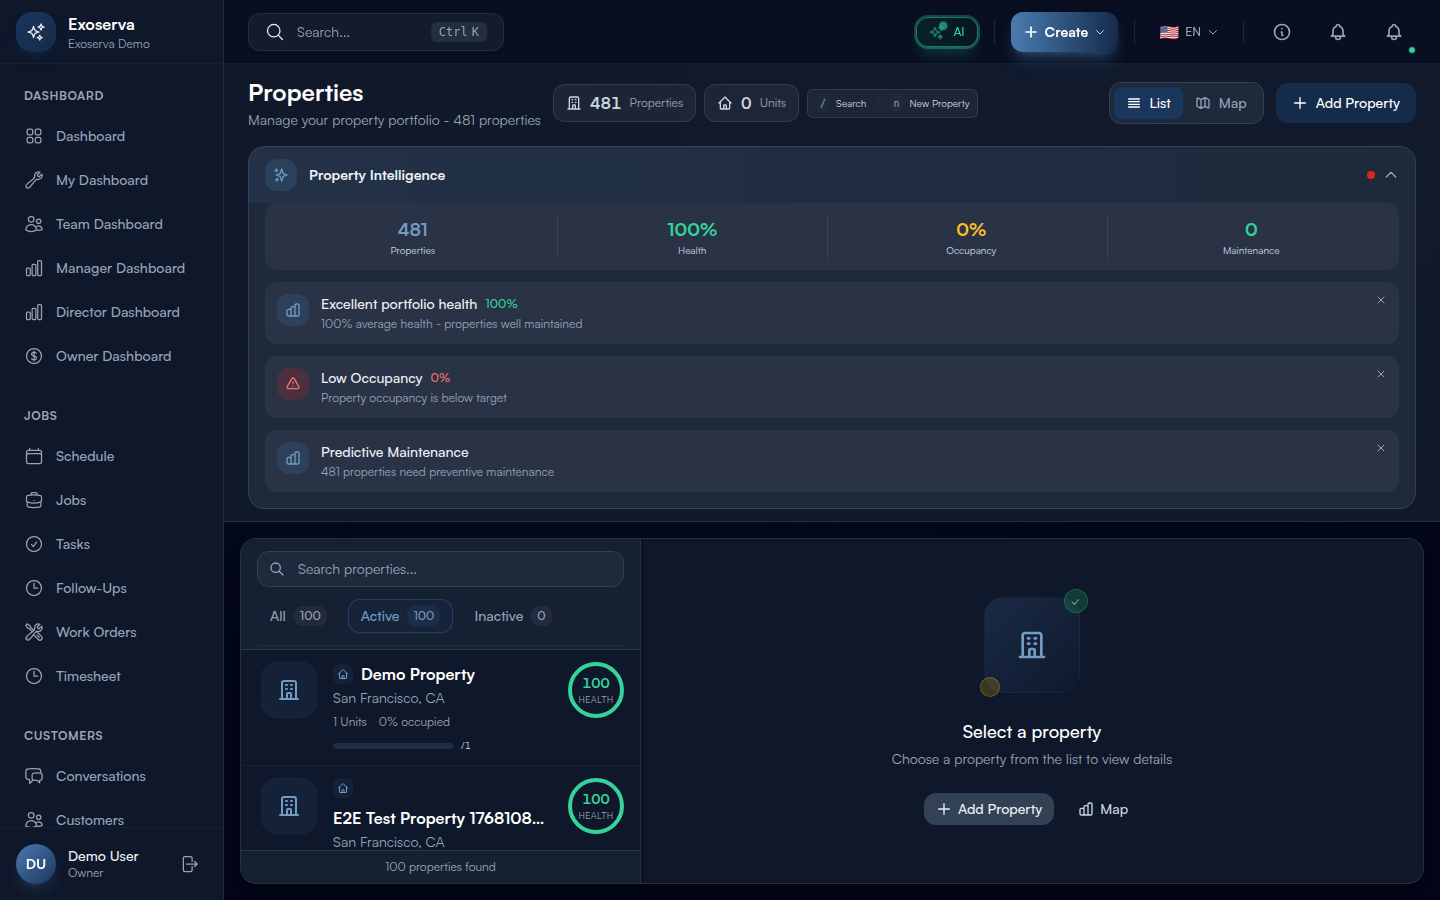
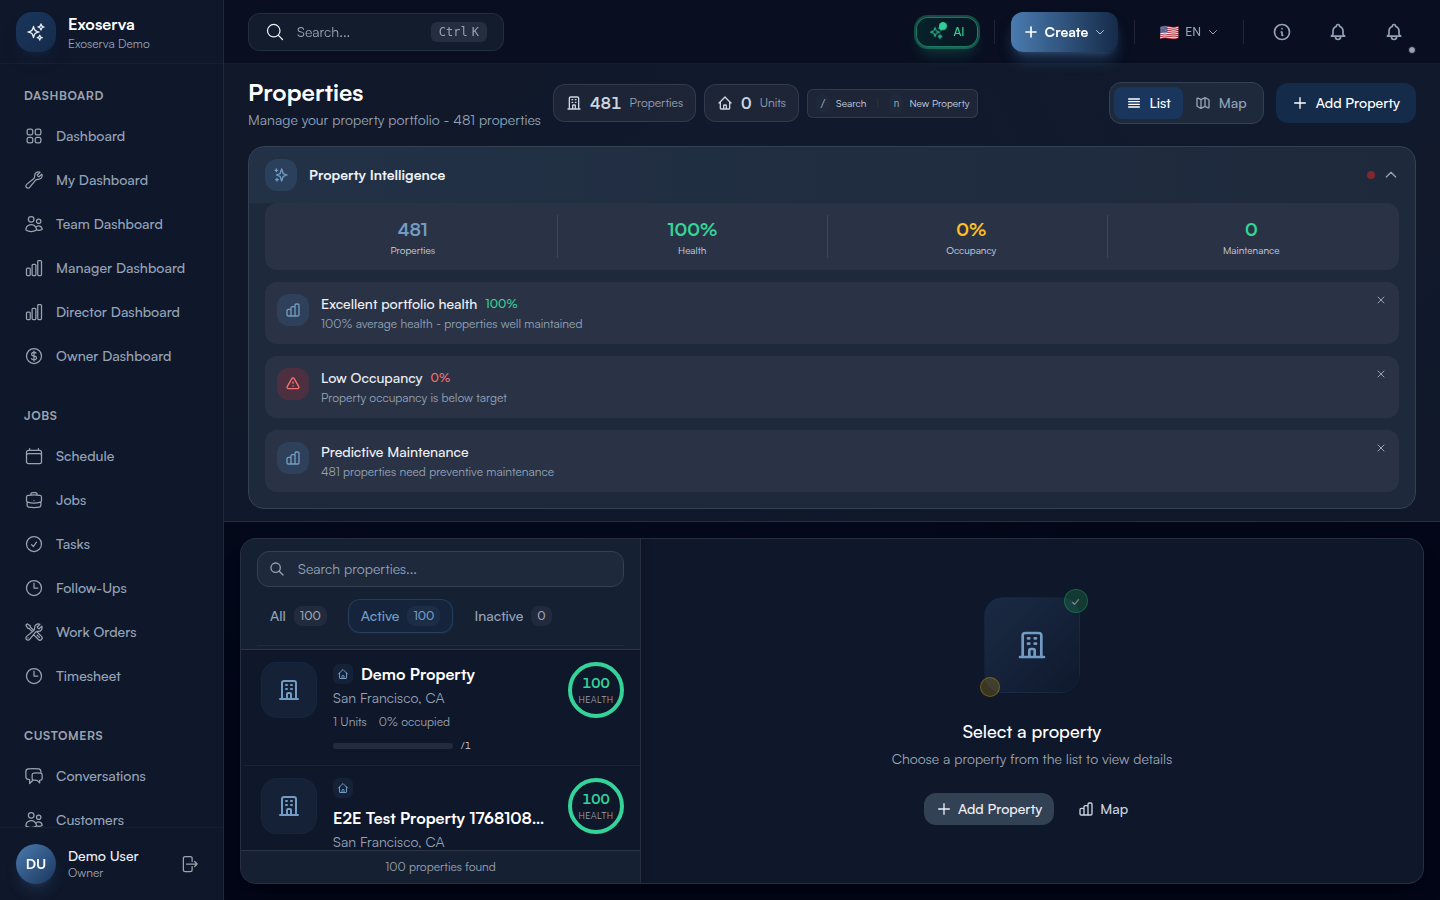
Step 1: Navigate to the Properties Page
Click “Properties” in the left sidebar. The page opens with a header area containing summary stat chips across the top, each showing an icon, a bold numeric value, and a label. These inline metrics include total property count (building icon), residential count (home icon), commercial count (building icon), and properties with maintenance alerts (warning icon in yellow or red). Properties with critical maintenance issues display a pulsing ring animation around their stat chip to draw attention.
Below the stats, a filter bar provides toggle buttons for property type (All, Residential, Commercial, Industrial, Mixed) and status (All, Active, Inactive). Each filter button shows a count badge indicating how many properties match. The property list uses a ListDetailLayout with a scrollable list panel on the left and a detail panel on the right that appears when you select a property. Use the search bar at the top of the list to filter by property name, address, or customer name.
Tip: The property type filter buttons show icons matching each type: a home icon for residential, a building icon for commercial, a server icon for industrial, and a layers icon for mixed-use. Use these visual cues to quickly scan your portfolio composition.
Warning: If your property list is empty, you will see a prompt to add your first property. Properties must be created before you can link jobs, assets, or maintenance schedules to them.
Step 2: Add a New Property
Click the “Add Property” button in the top-right corner of the Properties page. A modal dialog opens with the following fields: Property Name (text, required – a descriptive label like “Oak Street Apartments” or “Downtown Office”), Property Type (dropdown: Residential, Commercial, Industrial, Single Family, Multi Family, Condo, Townhouse, Apartment Complex, Mixed Use, HOA), and an Address section powered by the Google Places autocomplete component.
Start typing in the Address field and the AddressAutocomplete component will display matching suggestions from Google Places. Select a suggestion to auto-populate the street address, city, state, ZIP code, and geocoordinates. You can also enter a Customer to link the property to an existing customer record. Click “Save” to create the property – it will immediately appear in the list with a default health score and zero units.
Step 3: View Property Overview
Click any property in the list panel on the left to open its detail view in the right panel. The detail view header shows the property name in large white text, the full street address below it, and a Health Score Ring on the right side – a circular SVG gauge displaying the numeric health score (0-100) with a colored arc that is green for scores 90+, yellow for 70-89, orange for 50-69, and red for below 50. Properties with critically low scores (below 50) display a pulsing animation on the ring.
Below the header, an “Edit” button (pencil icon) lets you modify the property details. The overview section displays the property type icon (home for residential, building for commercial, server for industrial, briefcase for HOA), the linked customer name, and summary statistics including total unit count, occupancy rate as a percentage with a color-coded mini progress bar (green at 90%+, yellow at 70%+, red below 70%), active work order count, and days since the last service visit.
Step 4: Review the Property Health Score
The Health Score is displayed as a prominent ring gauge on both the property list item and the detail view. The score aggregates three factors: asset condition (average condition rating of all equipment linked to the property), maintenance compliance (percentage of maintenance schedules that are up-to-date versus overdue), and recent service history (frequency and recency of completed jobs). The calculateHealthScore function combines these factors into a single 0-100 rating.
The score ring uses getHealthScoreColor to apply visual styling: green (score >= 90) indicates excellent condition, yellow (70-89) indicates good but needs attention, orange (50-69) indicates fair with issues, and red (below 50) indicates poor condition requiring urgent action. The background card also changes: green-tinted for 90+, yellow-tinted for 70+, orange-tinted for 50+, and red-tinted below 50. In the property list, the health score ring appears next to each property name so you can visually scan and prioritize properties that need attention.
Step 5: Manage Units and Spaces
For multi-unit properties (apartments, office buildings, HOA communities), click the “Units” tab in the property detail view. The units section displays an Occupancy Bar showing the ratio of occupied to total units as a horizontal progress bar with a percentage label (for example, “12/15 (80%)”). Green indicates 90%+ occupancy, yellow indicates 70%+, and red indicates below 70%.
Click “Add Unit” to open the unit creation form with fields for Unit Number/Name (text, such as “101,” “Suite 3A,” or “Building B - Floor 2”), Unit Type (dropdown), Status (dropdown with options like occupied, vacant, maintenance), and Square Footage (number). Each unit row in the list shows its name, type, status with a color-coded badge, and quick-action buttons. The occupancy status configuration uses distinct colors for each status to help you visually scan the unit roster.
Step 6: Review Maintenance Alerts
The property detail view includes a Maintenance Alerts Card that summarizes the property’s maintenance status at a glance. When all maintenance is current, the card displays a green “All Up to Date” message with a checkmark icon and the subtext “No overdue maintenance items.” When issues exist, the card title changes to show the count (for example, “2 Overdue Alerts”) and displays categorized alert rows.
Each overdue alert appears in a red-tinted row with a warning icon, the maintenance category name, a “X days overdue” label in red text, and a “Schedule Now” button (red variant) for immediate action. Each due-soon alert appears in a yellow-tinted row with a calendar icon, the category name, a formatted due date, and a “Schedule” button (secondary variant). The alert thresholds are defined in SERVICE_HISTORY_THRESHOLDS – properties without service for an extended period also surface a “Last service: Xd ago” label in yellow on the property list item.
Step 7: View Property on the Map
The property detail page includes an embedded Google Map showing the exact location based on the geocoded address. The map marker is positioned using the latitude and longitude stored when you entered the address via the Google Places autocomplete. Click the map to open the location in Google Maps in a new tab for turn-by-turn directions. This map integration helps dispatchers estimate travel times between properties and helps technicians navigate to unfamiliar job sites.
On the main Properties page, you can also view all properties on the Schedule Board map view (accessible from the Schedule page by clicking the “Map” toggle). This overlay shows property markers alongside technician locations, giving dispatchers a geographic view of their entire service area for route optimization.
Step 8: Review Service History
Click the “History” or “Jobs” tab in the property detail view to see all completed and scheduled jobs linked to this property in chronological order. Each job entry shows the job title, service type, assigned technician, completion date, and status badge (green for completed, blue for scheduled, amber for in progress). The “Last service” indicator on the property list item shows how many days have elapsed since the most recent completed job, highlighted in yellow if it exceeds the stale-service threshold.
Use the date range filters to narrow the history to a specific period, or filter by job type to find specific service records. This historical view is invaluable for diagnosing recurring issues – for example, if a property has had three plumbing calls in the last 90 days, it may indicate a systemic problem that requires a more comprehensive repair rather than repeated spot fixes.
What’s Next?
Now that you’ve completed this guide, check out:
Need help? Post in the Tech Support category or contact support@exoserva.com.